import matplotlib.pyplot as plt
import numpy as np
import pandas as pdnp.random.seed(10)
size = 100
y_data = np.cumsum(np.random.randn(size) * 100.0)
y_data_2 = np.cumsum(np.random.randn(size))
y_data_3 = np.cumsum(np.random.randn(size) * 100.0)
x = np.linspace(0.0, 10.0, size)plt.scatter(x,y_data)<matplotlib.collections.PathCollection at 0x127781370>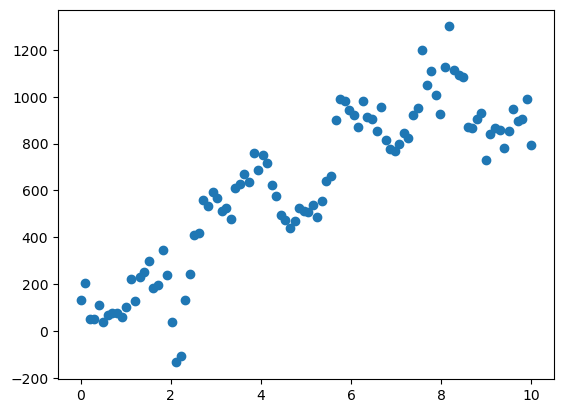
price_data = pd.DataFrame(
    np.cumsum(np.random.randn(150, 2).dot([[0.5, 0.8], [0.8, 1.0]]), axis=0) + 100,
    columns=["Security 1", "Security 2"],
    index=pd.date_range(start="01-01-2007", periods=150),
)
symbol = "Security 1"
dates_all = price_data.index.values
final_prices = price_data[symbol].values.flatten()price_data.index.names=['date']
price_data| Security 1 | Security 2 | |
|---|---|---|
| date | ||
| 2007-01-01 | 101.081239 | 101.483726 |
| 2007-01-02 | 100.405215 | 100.596704 |
| 2007-01-03 | 100.449096 | 100.569060 |
| 2007-01-04 | 101.446296 | 102.097565 |
| 2007-01-05 | 100.361914 | 100.826963 |
| ... | ... | ... |
| 2007-05-26 | 94.435223 | 94.219550 |
| 2007-05-27 | 93.879329 | 93.549650 |
| 2007-05-28 | 95.058473 | 95.068661 |
| 2007-05-29 | 94.784069 | 94.489578 |
| 2007-05-30 | 95.480560 | 95.187888 |
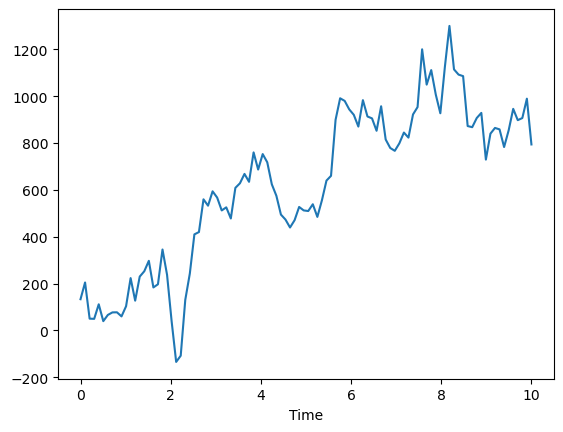
plt.figure()
plt.plot(x, y_data)
plt.xlabel("Time")
plt.show()