library(maps)
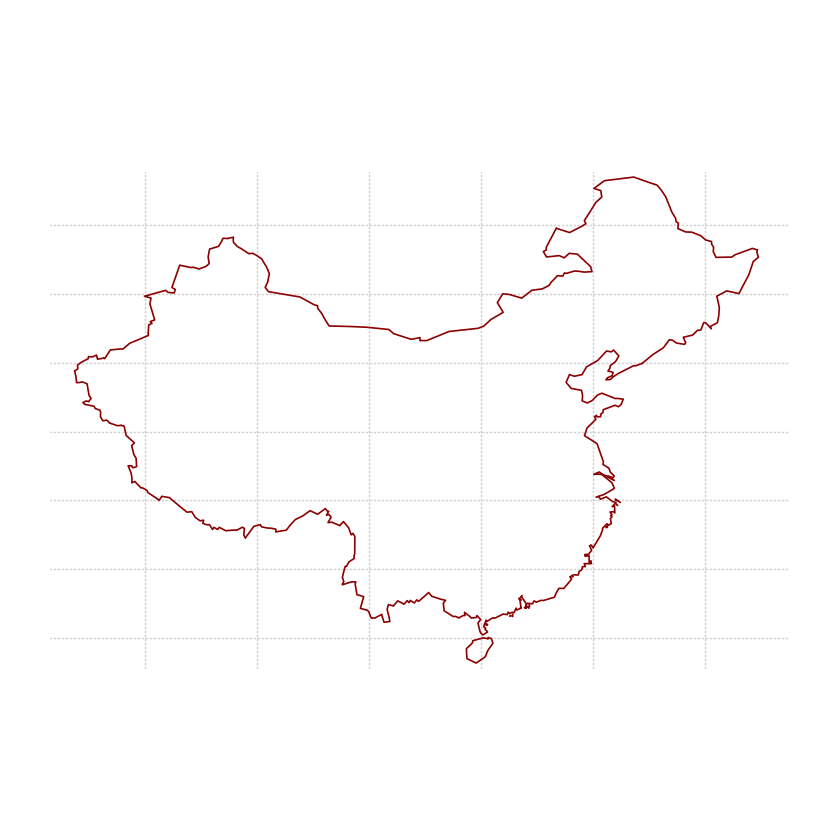
map(
database = "world", regions = "china",
col = "red4", xlim = c(72, 137), panel.first = grid()
)
https://xiangyun.rbind.io/2022/02/draw-china-maps/
library(maps)
map(
database = "world", regions = "china",
col = "red4", xlim = c(72, 137), panel.first = grid()
)
library("mapdata")
map(
  database = "china",
  col = "red4", xlim = c(72, 137), panel.first = grid()
)#mapdata 中的map 函数,有内置的中国地图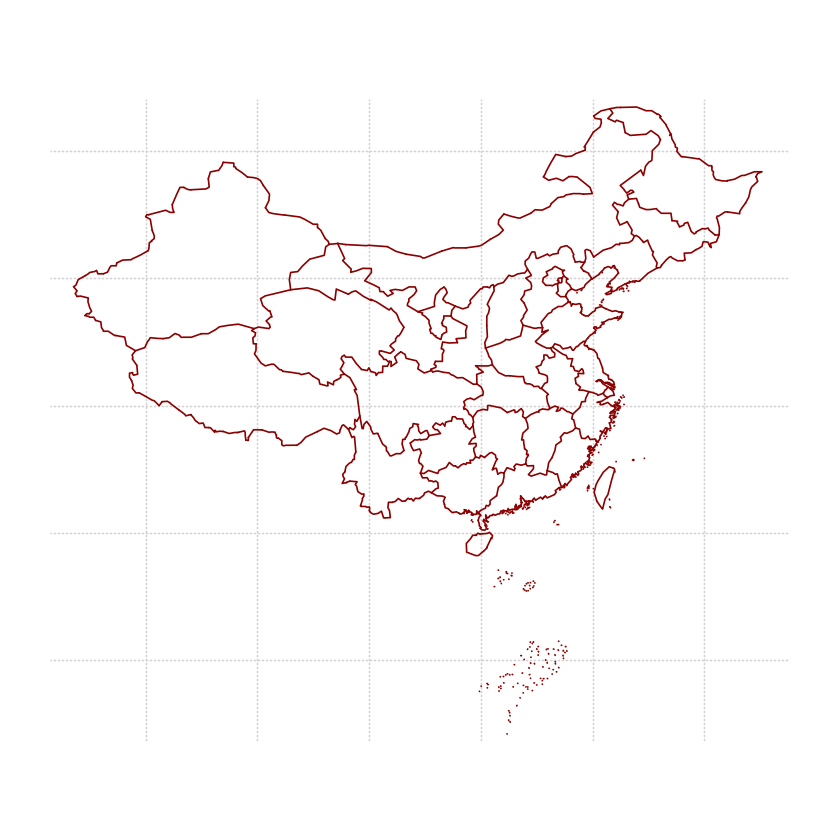
#install.packages("mapdata"#devtools::install_github('IRkernel/IRkernel')library(ggplot2)china_map<- map(database="china",plot=F)china_map$latNULLggplot() +
geom_path(
data = china_map, aes(long, lat, group = group),
color = "#FD9FA4", show.legend = F
) +
coord_map(projection = "mercator")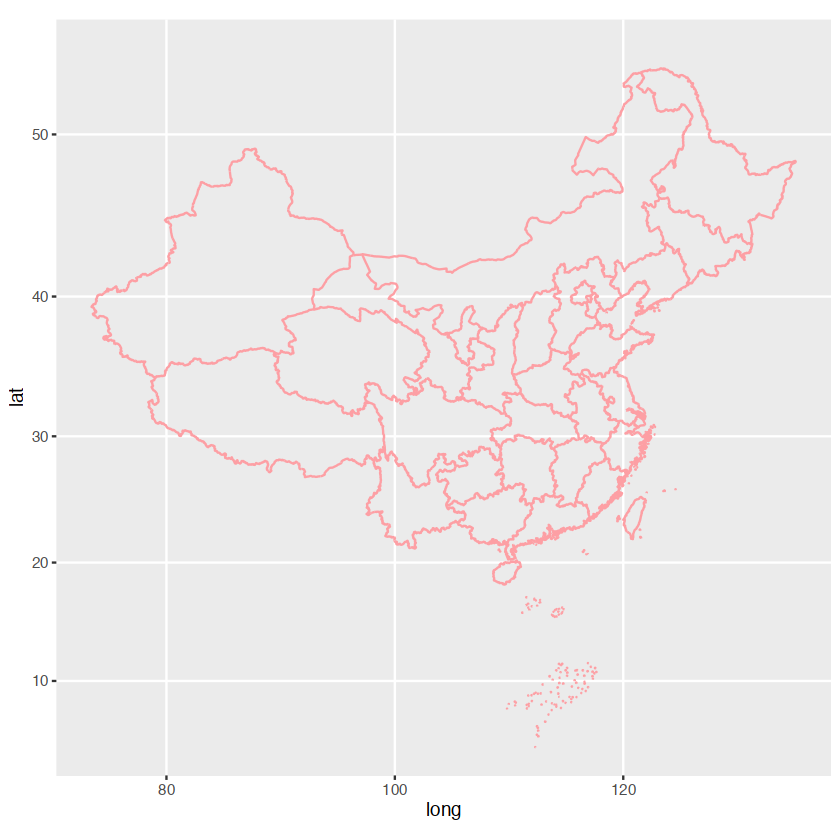
library(leaflet)
library(leafletCN) # 提供 geojsonMap 函数
dat <- data.frame(name = regionNames("china"), value = runif(34))
# 还有很多其他参数设置,类似 leaflet::leaflet
geojsonMap(dat, mapName = "china", palette = "RdBu", colorMethod = "bin")
#install.packages(“leafletCN”)
# 谷歌瓦片地图服务
library(leaflet)
leaflet() |>
  addTiles(urlTemplate = "https://mt1.google.com/vt/lyrs=m&x={x}&y={y}&z={z}") |>
  setView(116.347817690225, 39.997202126977, zoom = 16) |>
  addMarkers(116.347817690225, 39.997202126977)